New Information On Water Usage Recieved From City
Numbers don’t lie, but selectively used they can be misleading.
In the City’s material promoting the “Yes” vote, a base year of 2007 is used for the projection of increases in water demand through to 2016.
Here is the graph from the City’s marketing campaign information showing PROJECTED water usage.
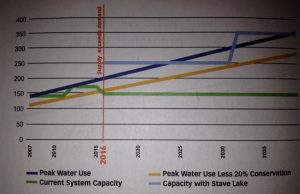
Using these numbers, the actual water usage since 2007 is ignored. Instead, growth in water demand is projected for each of the years following 2007 until Abbotsford reaches excess demand during the summer months of 2016.
I have now received from the City’s Water Project team the actual water usage for 2008 to 2011, which shows a significant difference between what the City “projections” and what actually occurred over the past four years.
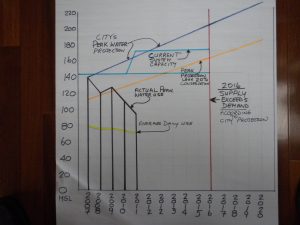
Here is the graph of ACTUAL water usage. My hand drawn graph shows both the City’s projections as well as the ACTUALS .
Year Peak Peak Average
MLD Date MLD
2011 93.1 7-Sep-11 70.6 (as of Sept 30, 2011)
2010 106.8 26-Jul-10 73.3
2009 126.6 22-Jul-09 76.9
2008 119.8 16-Jul-08 75.9
2007 139.2 12-Jul-07 78.2
MLD = Mega Liters Per Day (1 ML equals 1,000,000 Liters)
Based on this information, rather than the “projected” 15% growth in water demand, there has in fact been a 33% decrease. Conservative projections for 2011 would indicate usage of less than 25,800 ML, the lowest water usage since 2002. No one thought we had an urgent water problem back then. This is quite a different story than the one being told in the promotional material!
What can we learn from this new information?
1. There is an understandable skepticism regarding the “numbers” chosen for the City’s “yes vote” marketing material!
2. Using the City’s own projection assumptions, but applying them to the ACTUAL water usage since 2007, current capacity will not likely be exceeded until some time after 2016.
3. If we use the ACTUAL downward trending from 2007 and apply it to the ACTUAL usage numbers, available capacity will certainly not be exceeded until long after 2016. I suspect the real number is somewhere in between. Inevitably, the water usage trend is dependent upon new development and arrival of new businesses. Given the current, and short-term, projected, economic indicators, we are likely to experience relatively slow growth with no significant new development for the next number of years.
4. A further factor likely to reduce usage even more in 2012 is the fact that the new smart meters and conservation efforts have only been in place for a short time. I believe that, given the opportunity, these efforts and the people of Abbotsford will reduce water usage even more.
My conclusion is that the urgency portrayed in the promotional material regarding our projected water needs for the immediate future is inappropriate based on the facts of ACTUAL water usage. While, at some point in time, Abbotsford will need additional water, the “vote yes now or else” message doesn’t hold water.